ADAPTATION IN MOTION
Setting out a New Way Forward
13 & 14 June 2024
Paris, Carrousel du Louvre
 Add to calendar
REGISTER
Discover our speakers


2024 edition
Adaptation in Motion
Setting out a New Way Forward
Despite ongoing geopolitical tensions, 2024 should see the volatility and uncertainty of recent years yield to adaptation. Monetary policy should normalise as the growth versus inflation dilemma abates. Meanwhile, societies will work to absorb the technological revolution that AI is accelerating. Decarbonising all the world’s economies is urgent—yet global energy transition still faces major hurdles. The next Amundi World Investment Forum will explore how policymakers, financial services and investors can meet these challenges.
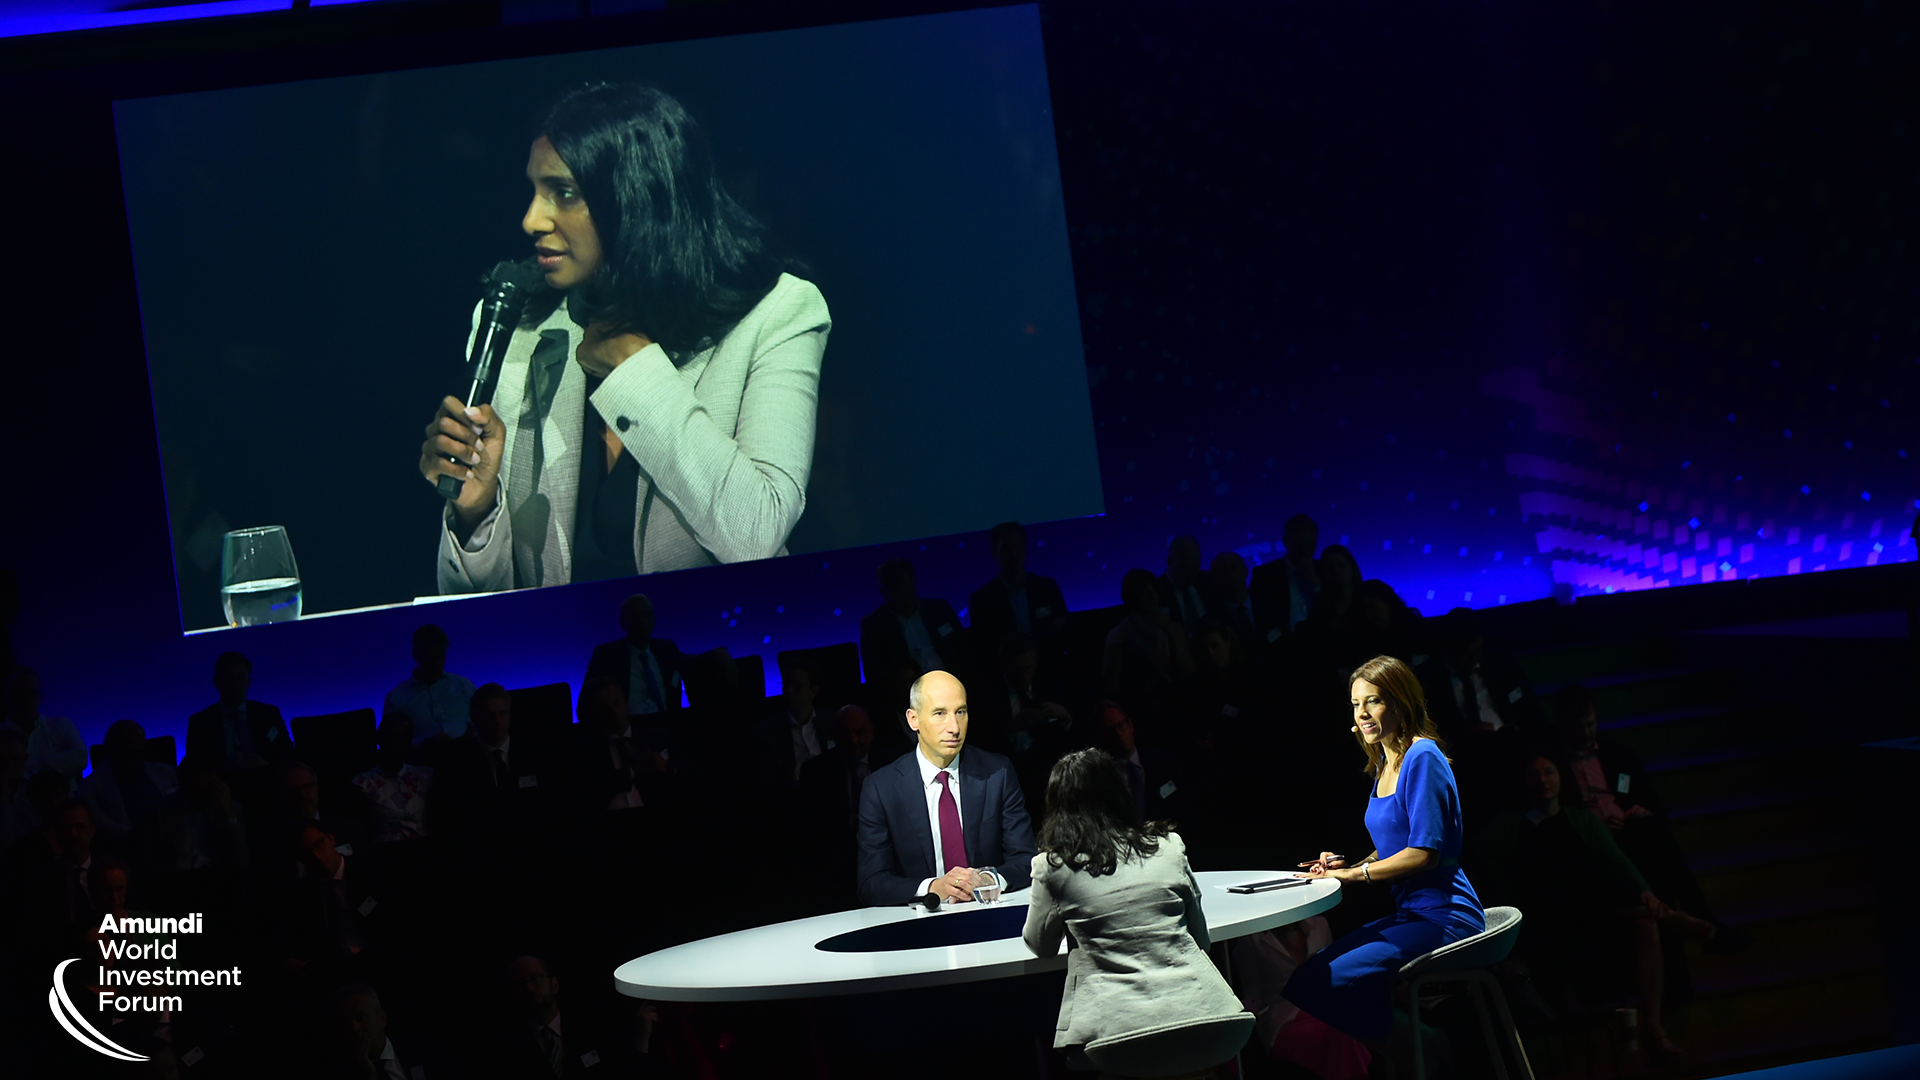
Discover the Amundi World Investment Forum


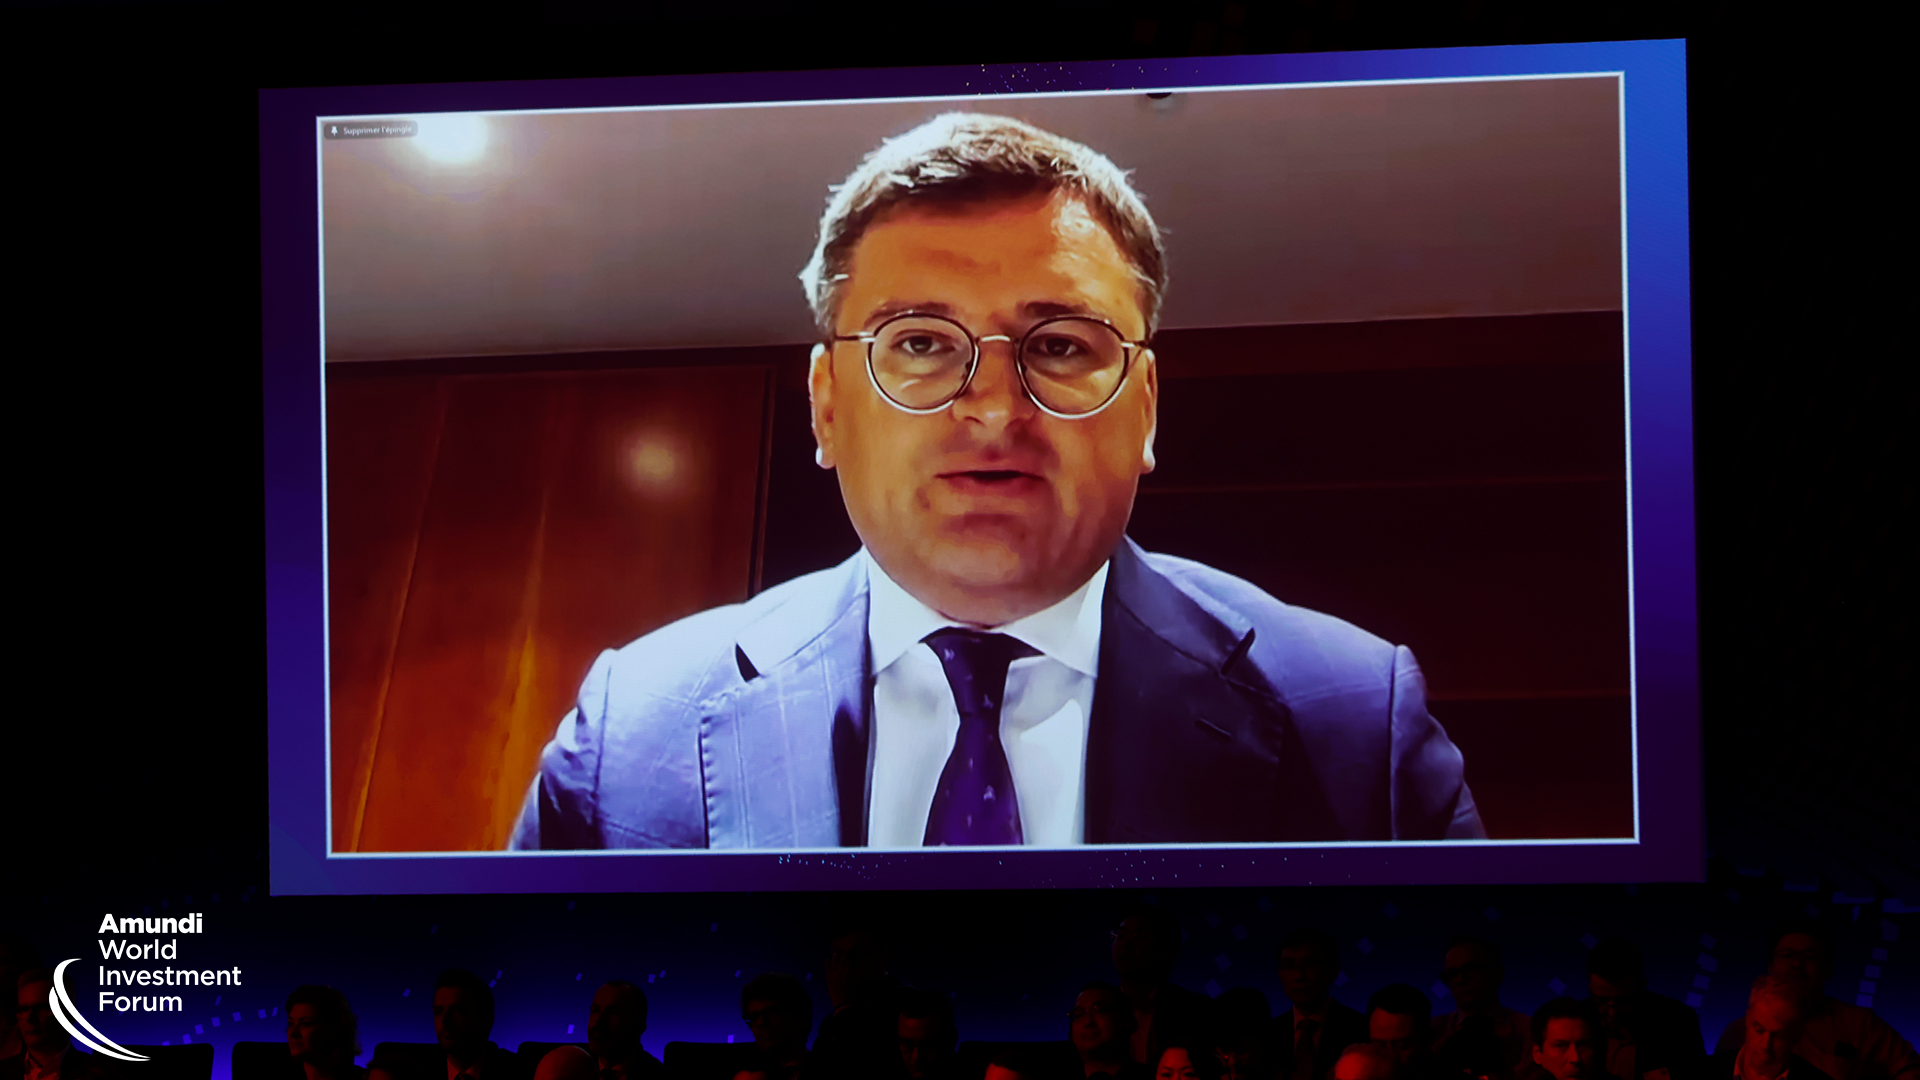
Established in Amundi’s calendar since its founding more than a decade ago, the Amundi World Investment Forum has become one of the leading events in asset management, sharing insights, expertise and thought-leadership with our clients from around the world. The event brings together investors across all spheres to discuss the new frontiers of our industry. Over the last thirteen editions, the Amundi World Investment Forum has been recognized for its high-quality discussions and distinguished speakers, addressing global challenges and confirming Amundi’s commitment to sustainable finance.

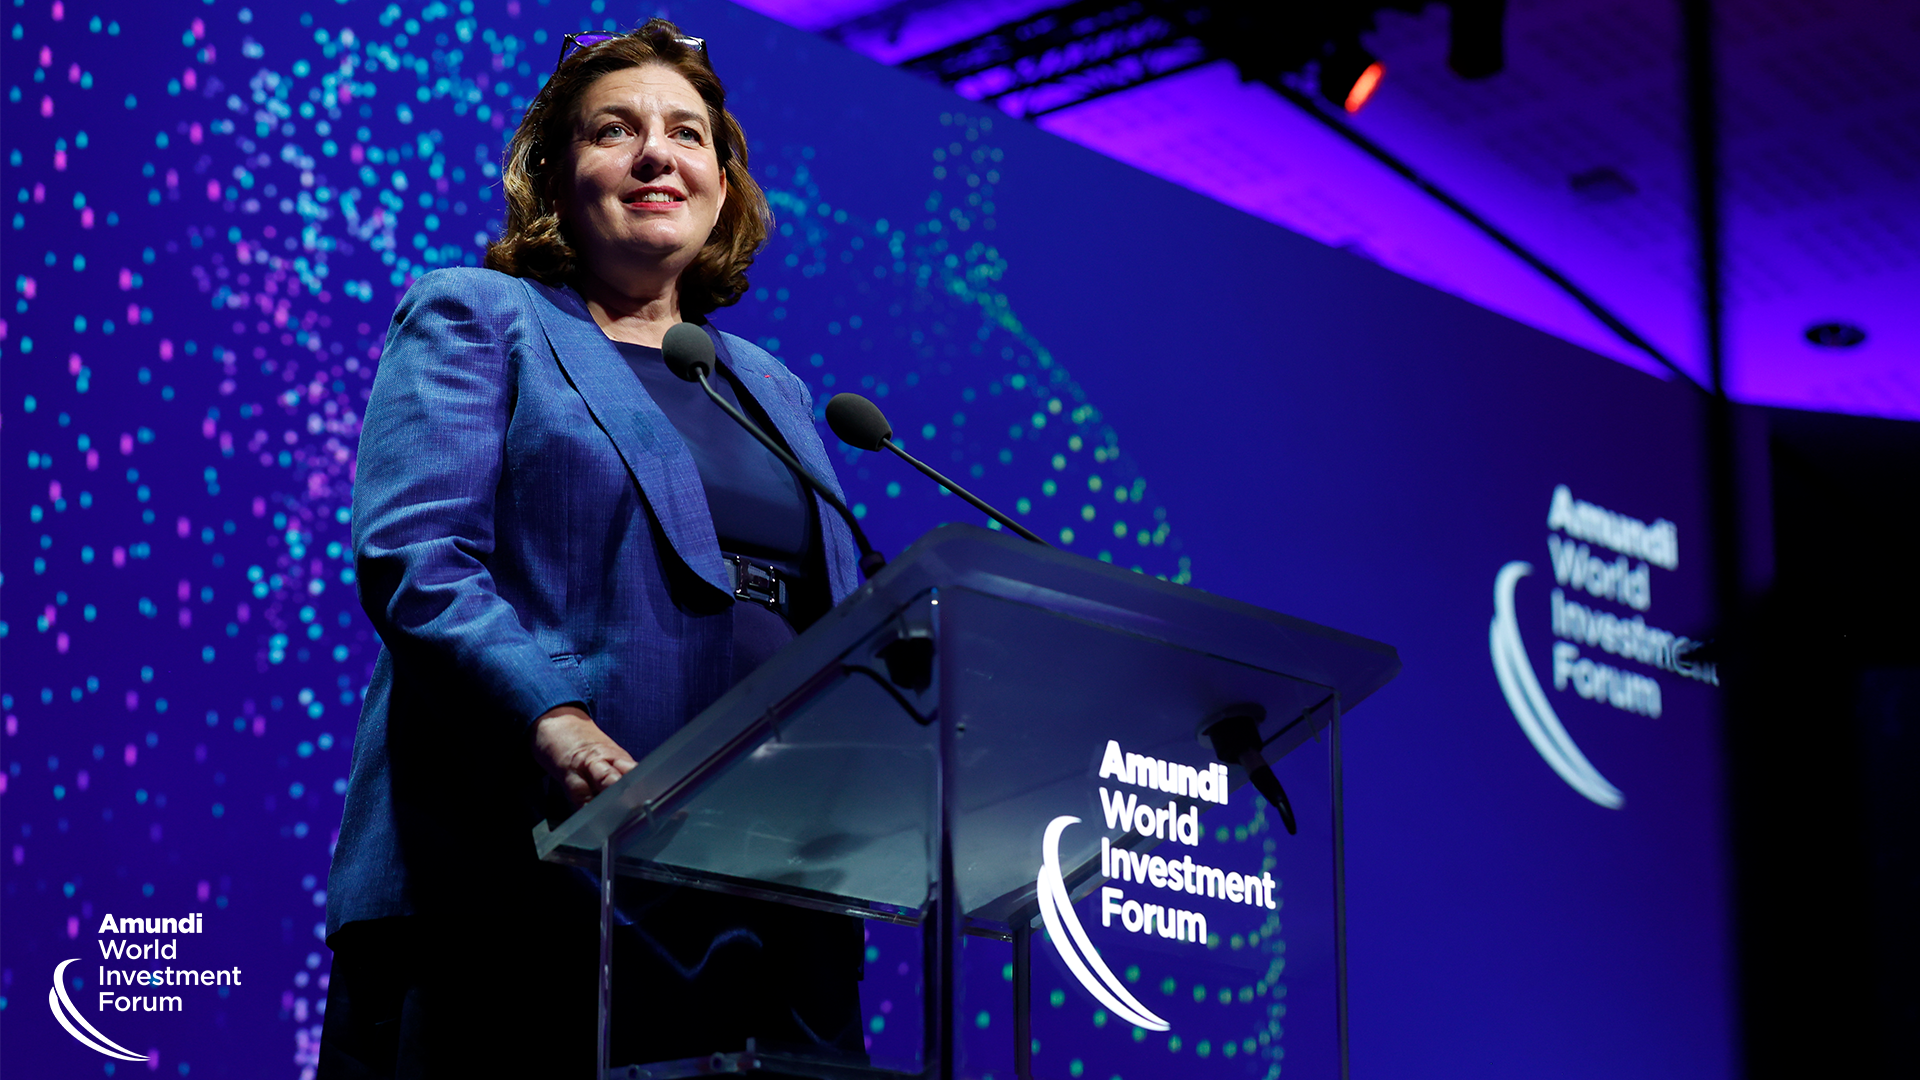
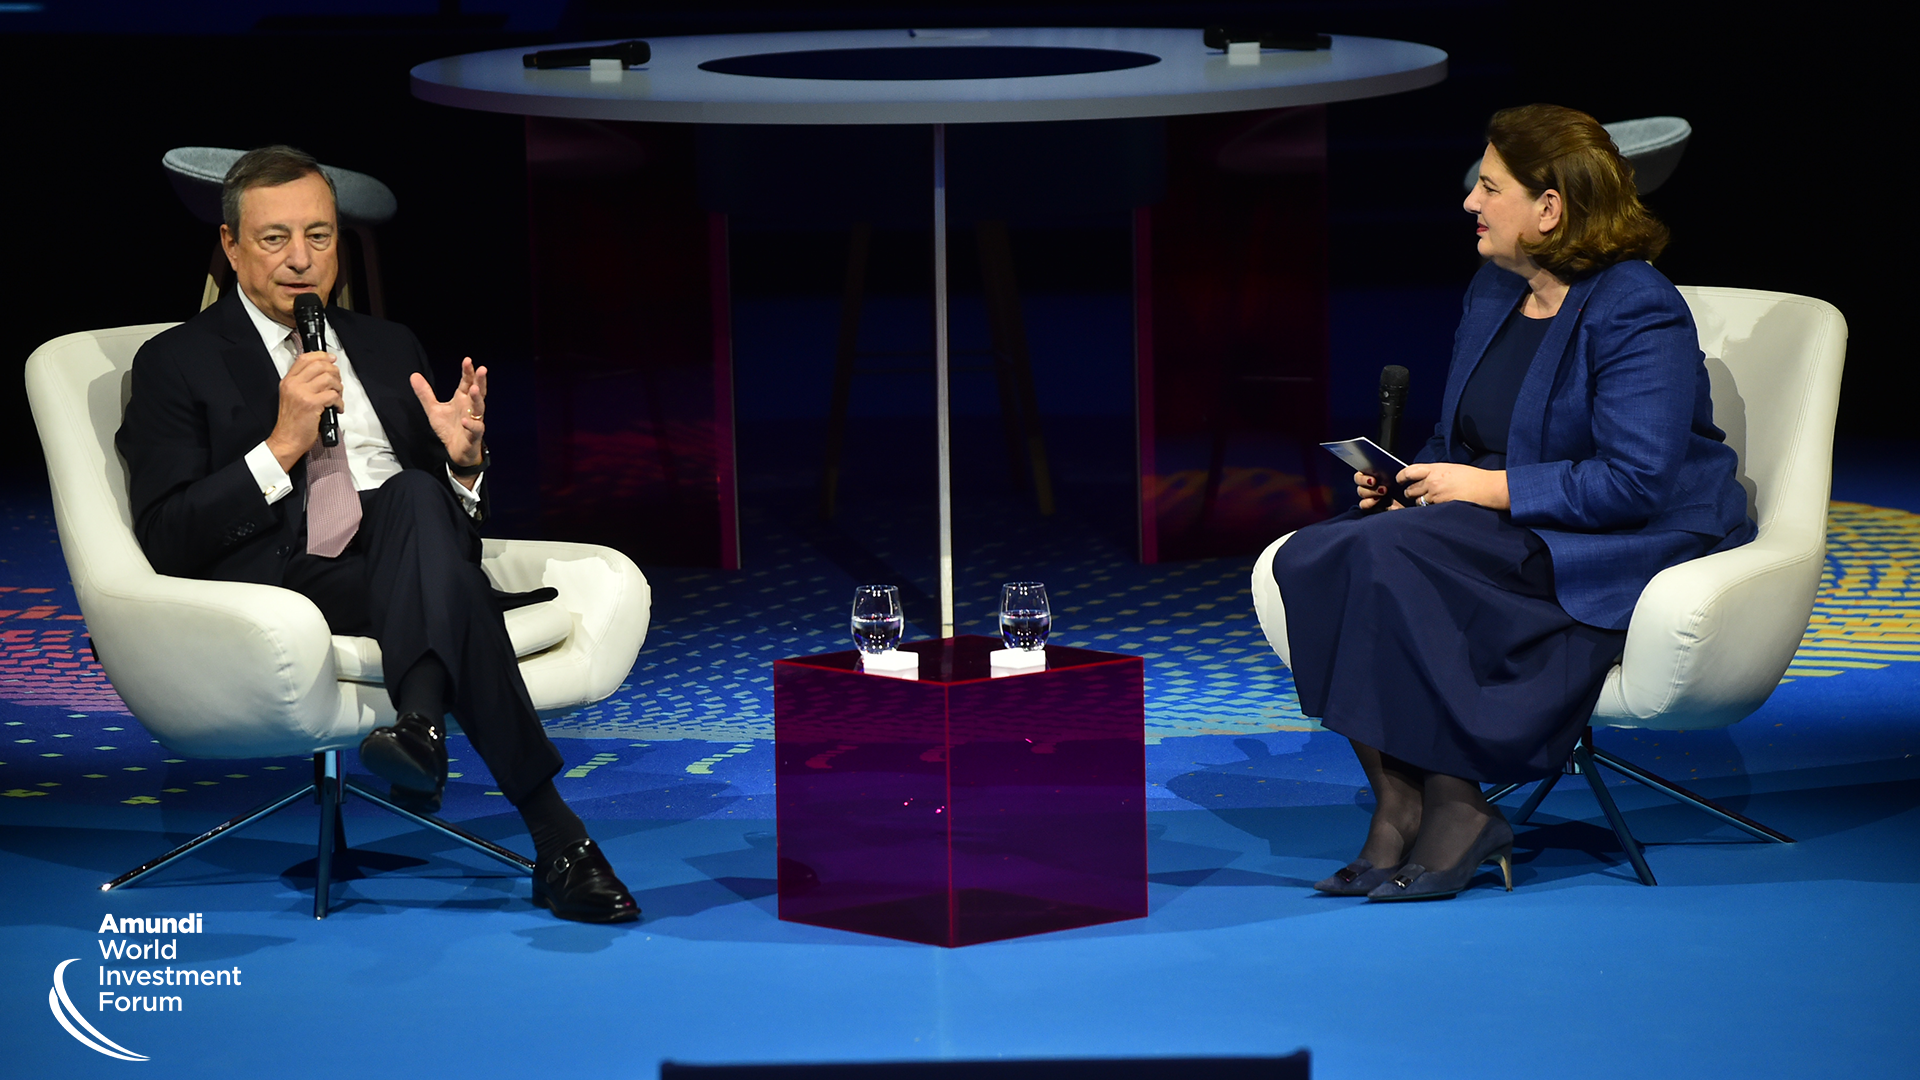
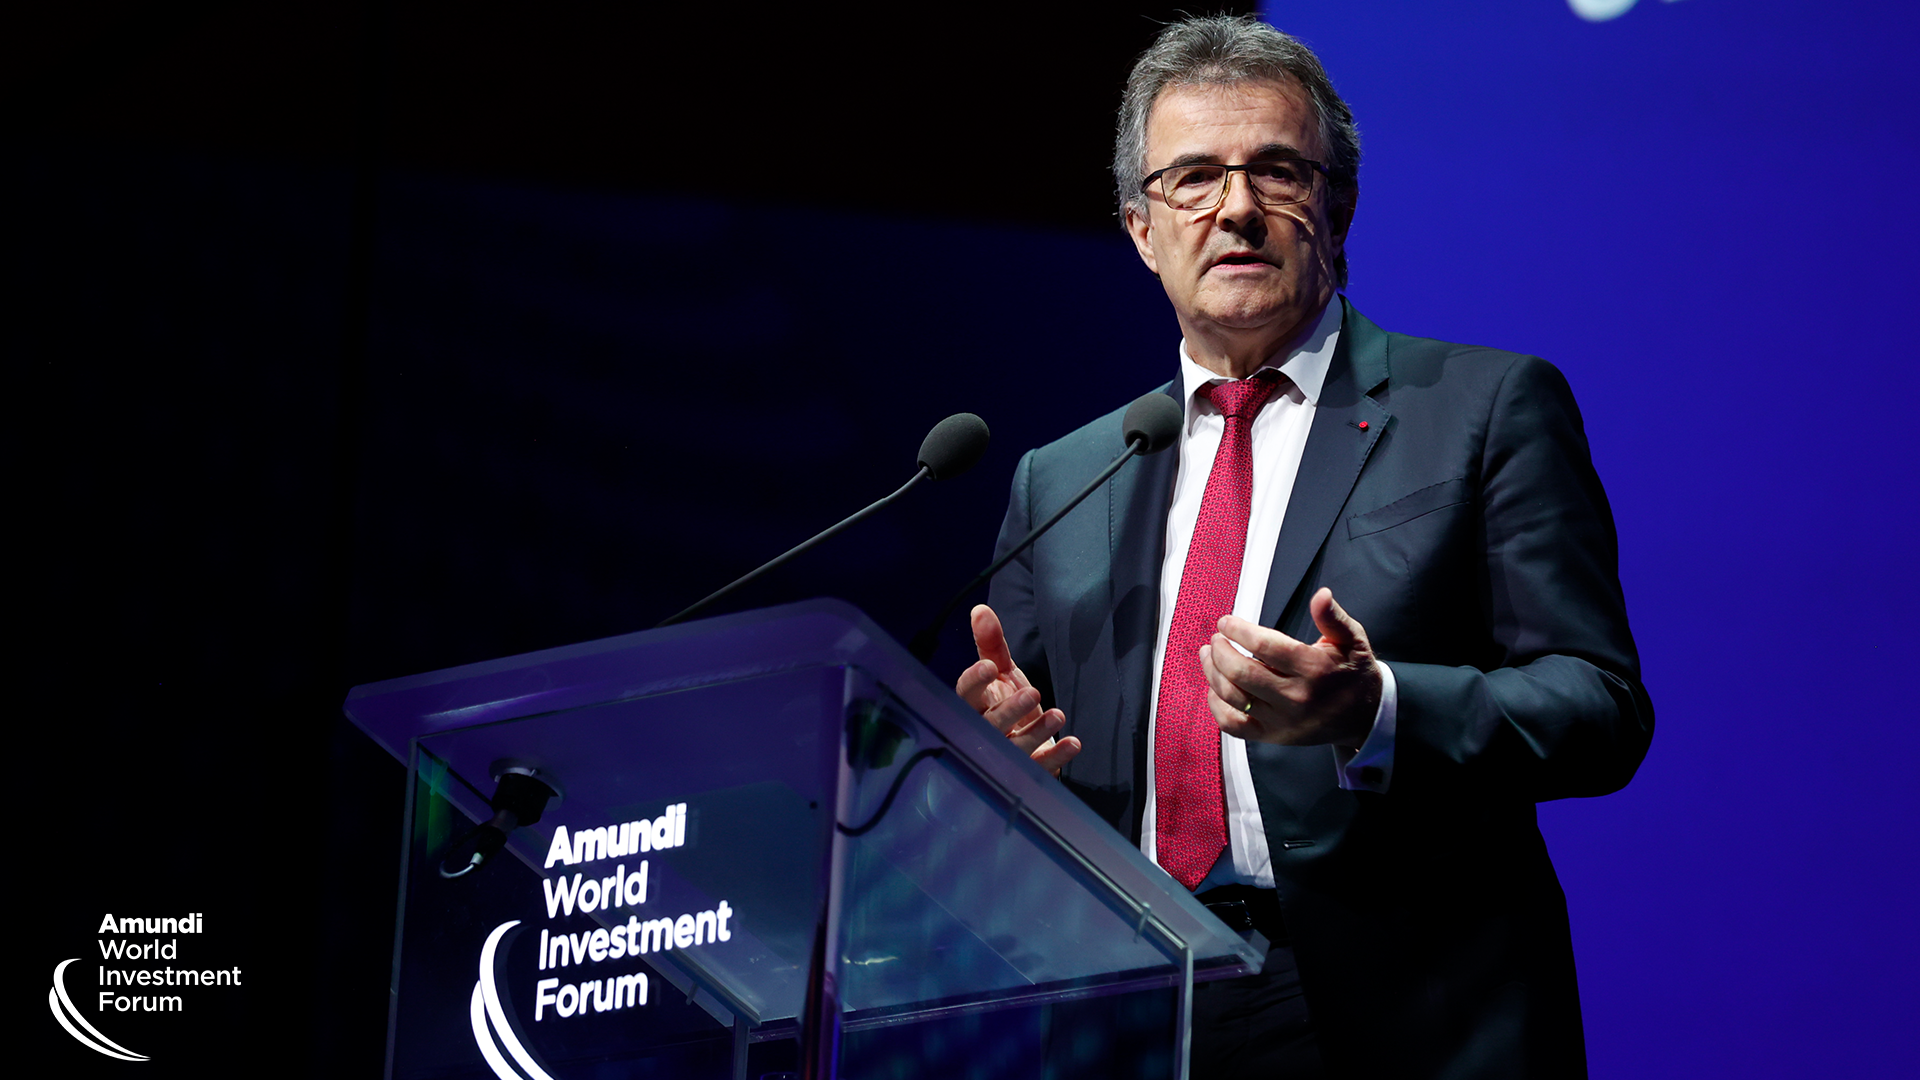
Valérie Baudson
Chief Executive Officer, Amundi
Investment Forum
event
per year
represented
Agenda
- 12:00pm - 1:30pm | WELCOME LUNCH
- 1:30pm - 3:30pm | PLENARY SESSION
- Geopolitics
- Macroeconomics
- 3:30pm - 4:30pm | BREAKOUT SESSIONS
- Geopolitics
- Real and alternative assets
- Stewardship focus
- 4:30pm - 5:30pm | PLENARY SESSION
- Energy Transition
- 7:30pm - 12:00am | Gala cocktail dinner in a prestigious venue
- 8:30am - 9:00am | WELCOME COFFEE
- 9:00am - 10:15am | PLENARY SESSION
- Tech
- 10:15am - 12:00pm | BREAKOUT SESSIONS
Breakout session 1
10:15am – 11:00am
- Macroeconomics
- Nature
- Saving goes digital
Breakout session 2
11:15am – 12:00pm
- Energy transition
- New challenges shaking up the role of banks
- Artificial Intelligence
- 12:00pm - 1:00pm | PLENARY SESSION
- Demographics
- Individual Savings
- 2:30pm | Closing cocktail lunch
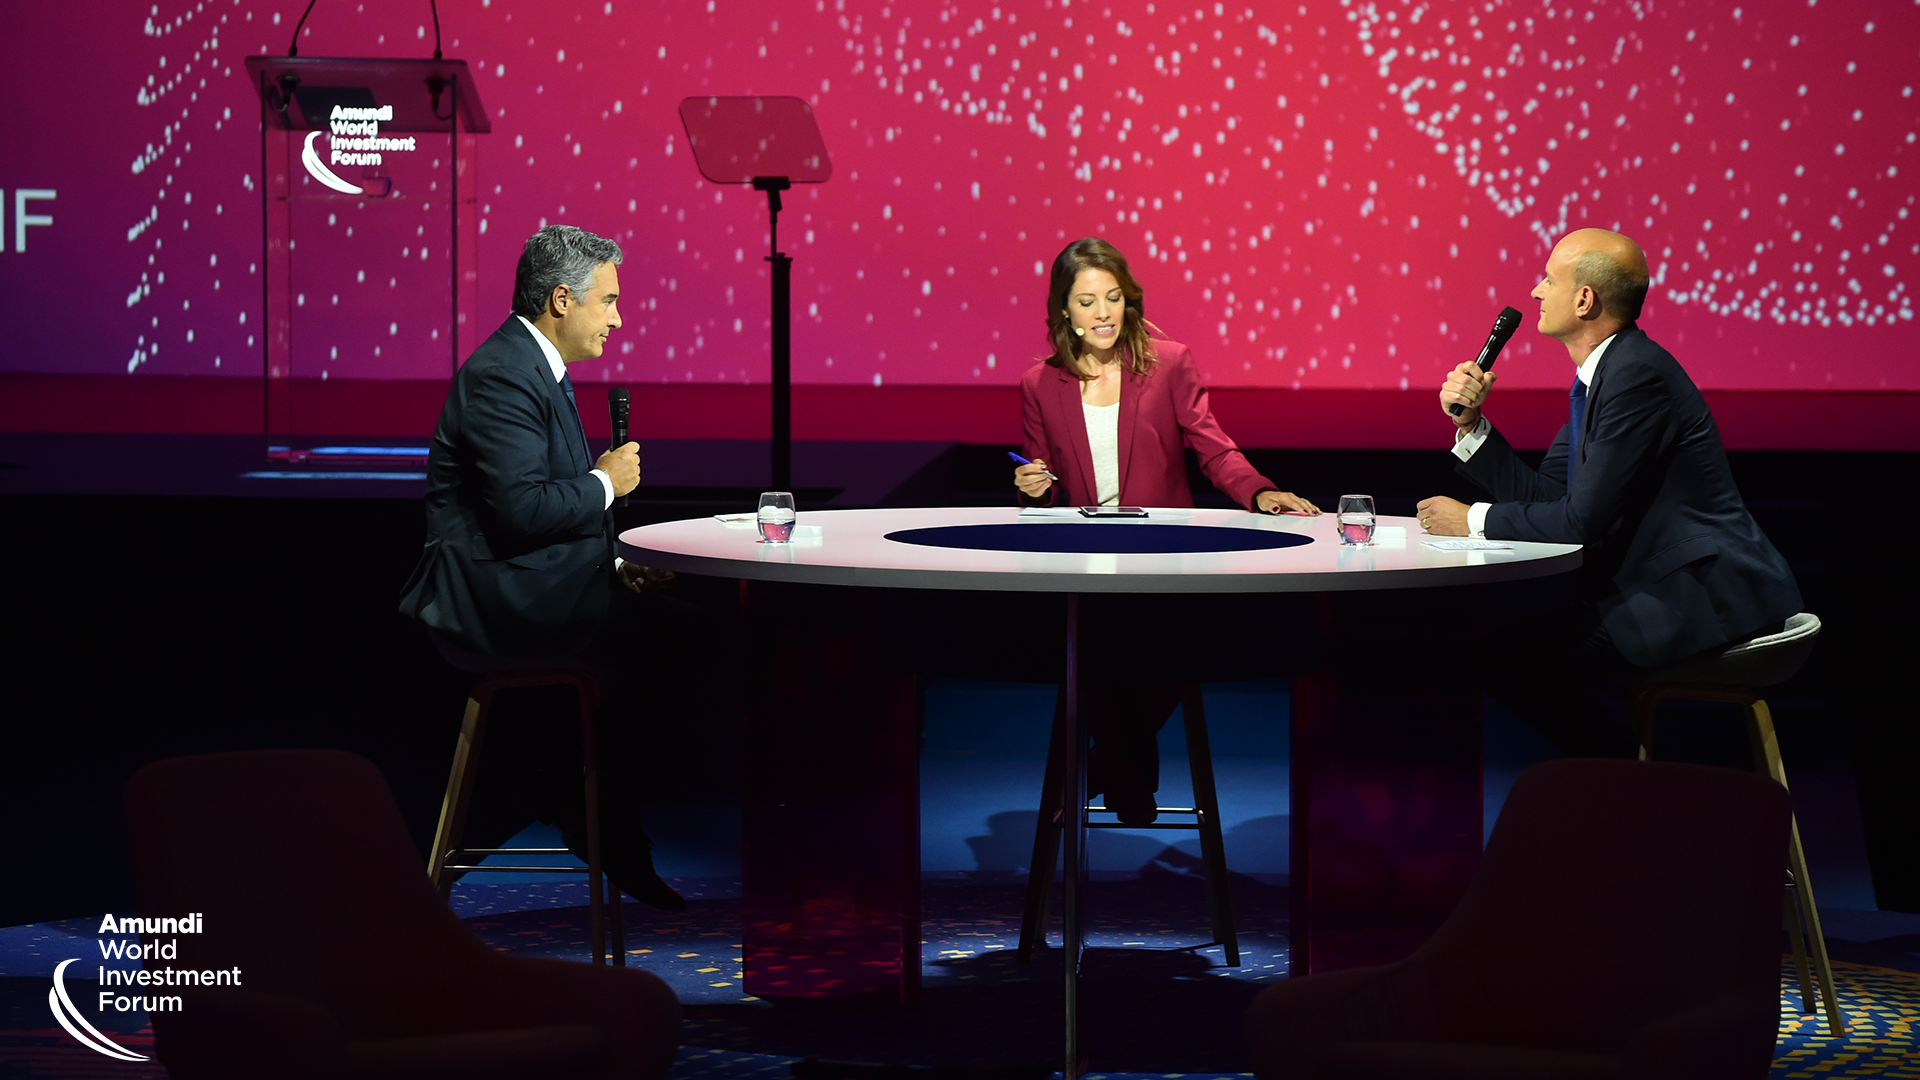
Plenary sessions
Participate in plenary sessions consisting of keynote and panel discussions showcasing distinguished figures from the realms of geopolitics, economics, and industry.
Thursday 13 June
Geopolitics
With elections worldwide, domestic and global politics intersect to reveal a changed landscape.
Macroeconomics
Major economic shifts—climate change, technological revolution and revised value chains—come as central banks wrestle with diverging inflation and growth expectations.
Energy Transition
What lies ahead as energy transition becomes an industrial race for leadership, incentive plans go head-to-head and companies engage fully with the task?
Friday 14 June
Demographics
Front and centre in both emerging and developed countries, demographic trends are rebalancing labour markets, affecting migration and reshuffling long-term investment.
Tech
Technological advances are revolutionising financial services, but implementation of AI is key.
Individual Savings
How can finance deploy the incentives, investment channels and financial education needed to deliver technology's promise of hyper-personalised retail investment?
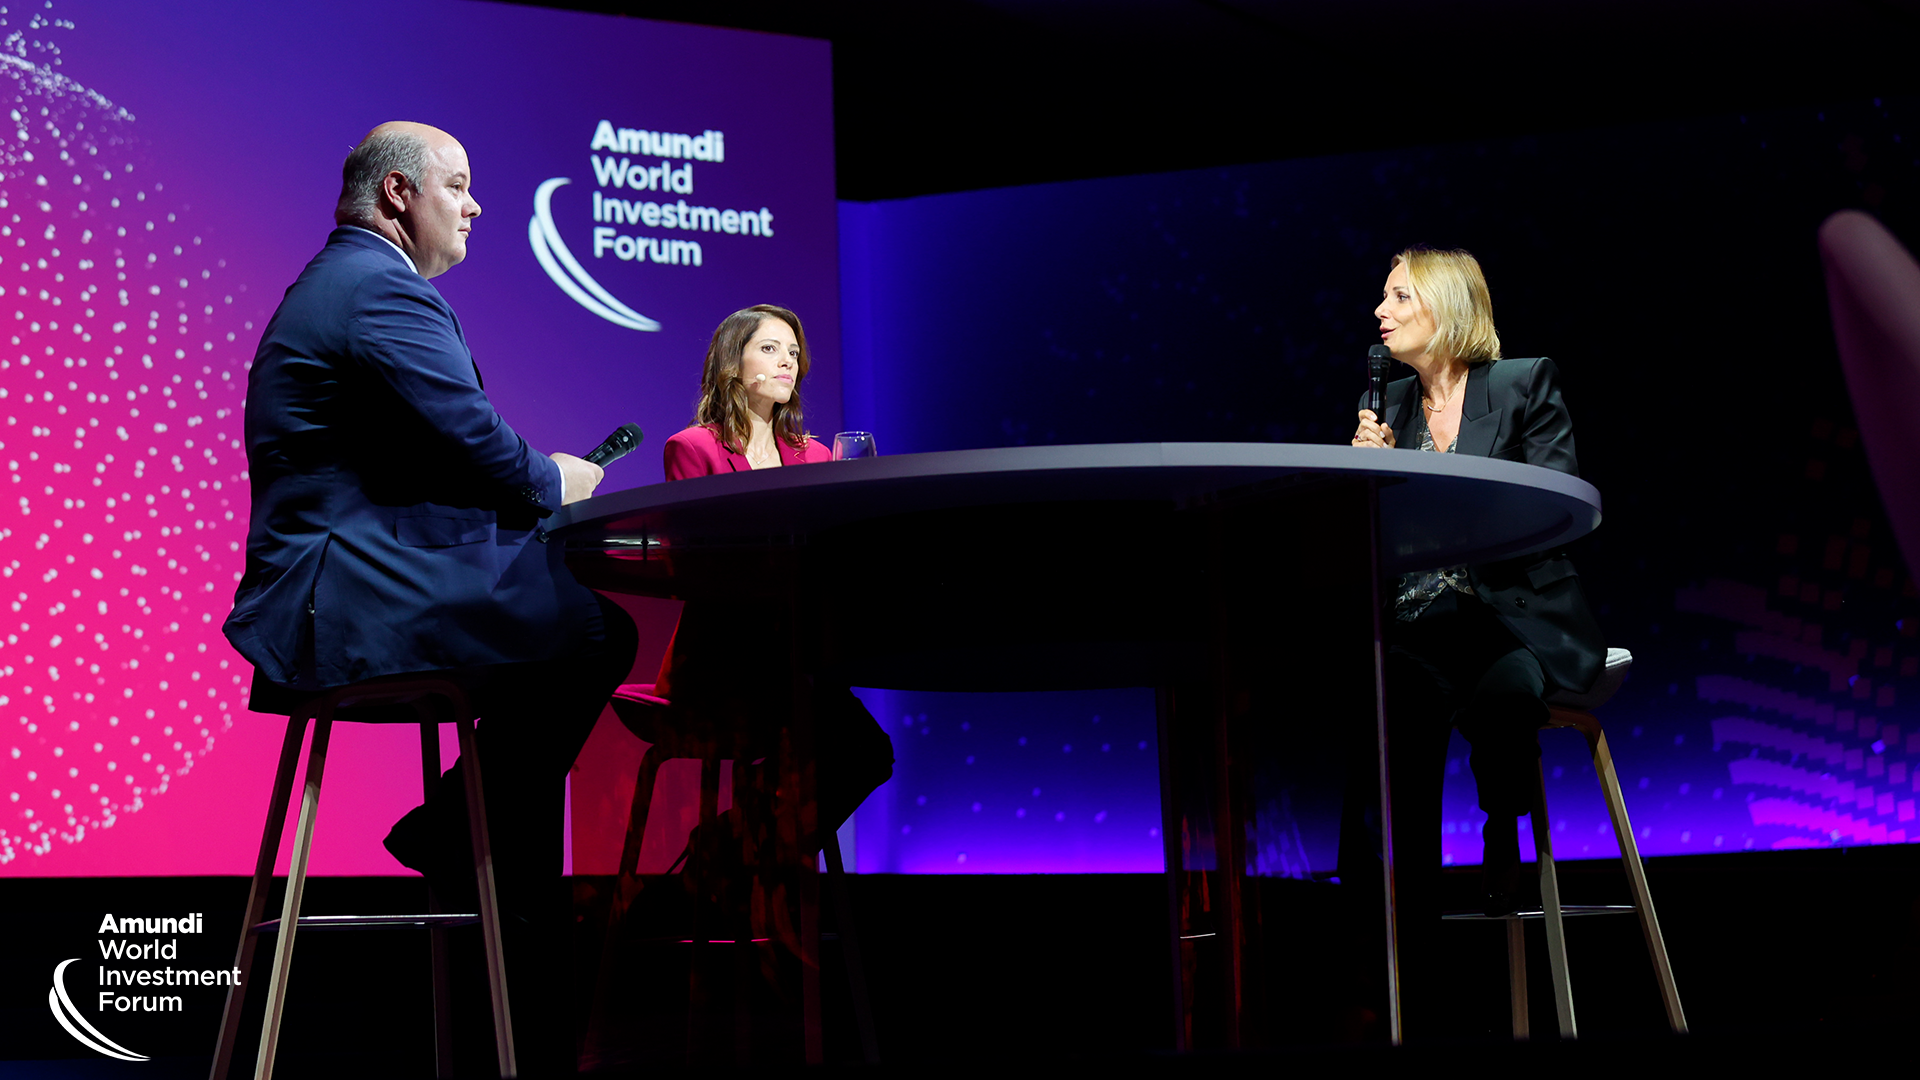
Breakout sessions
Join us for in-depth discussions with Amundi’s experts and your peers at sessions focused on the implications of current trends and policymaking for investors.
Thursday 13 June
Geopolitics
Factoring geopolitics into investment decisions
Real and alternative assets
Redrawing the allocation map with real and alternative assets
Stewardship focus
The new global momentum of corporate democracy
Friday 14 June
Session 1
Macroeconomics
How central banks are navigating climate change, high debt and bloated balance sheets
Nature
Innovative investment solutions to enhance natural capital
Saving goes digital
The meeting of technology and behavioural finance is reshaping how individuals invest
Session 2
Energy transition
The decarbonisation cost curve and its impact on net-zero approaches
New challenges shaking up the role of banks
The need to redesign the investment value chain in a new regulatory and interest rate environment
Artificial Intelligence
The coming impact on productivity, growth, sectors and stock-picking
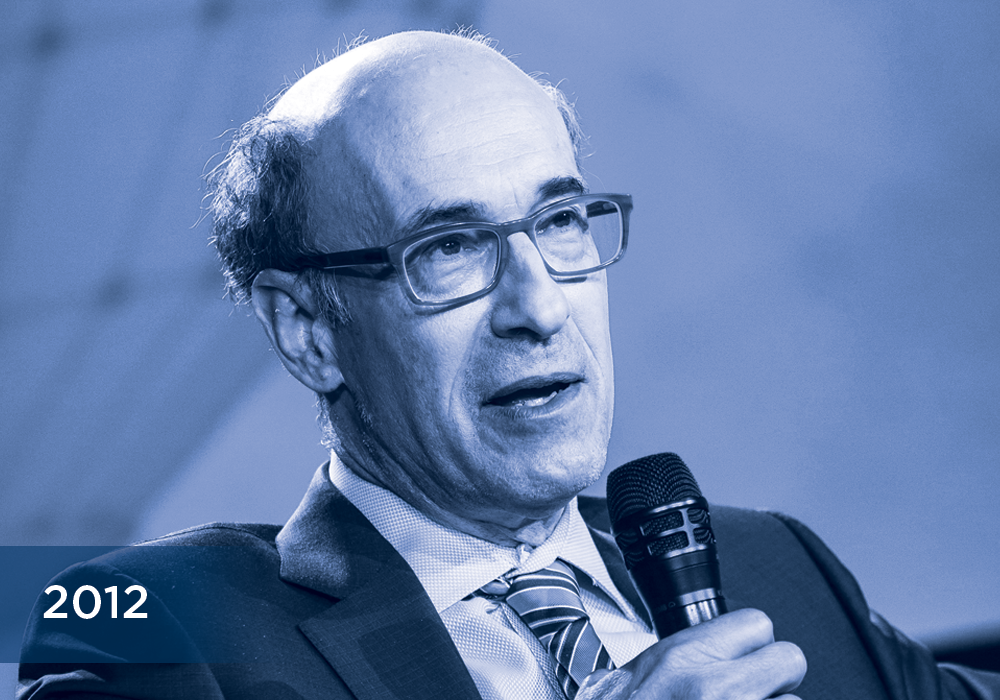
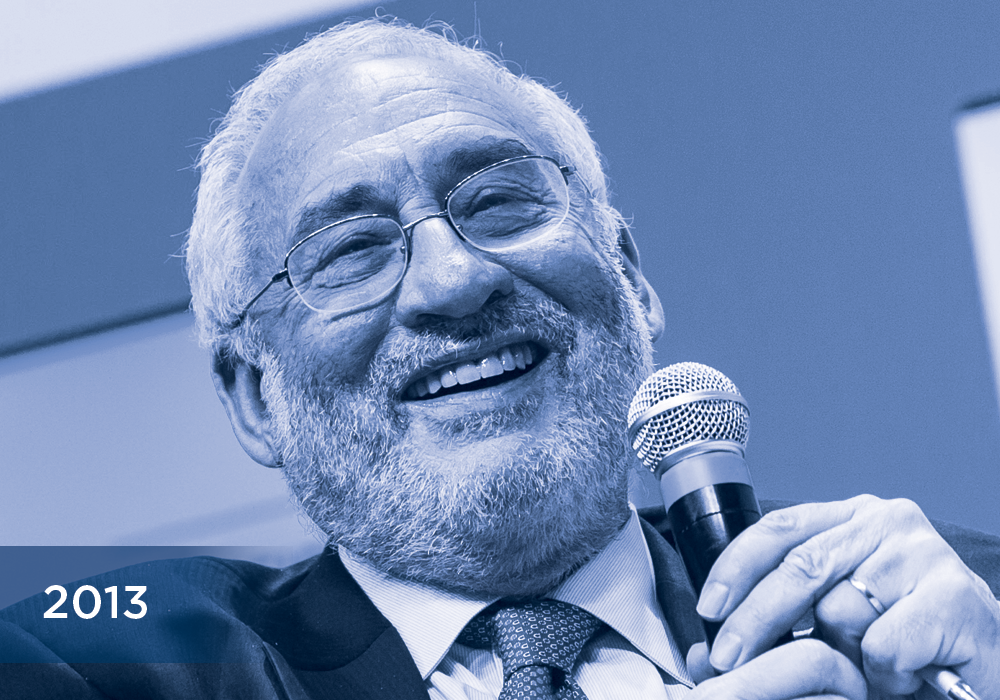
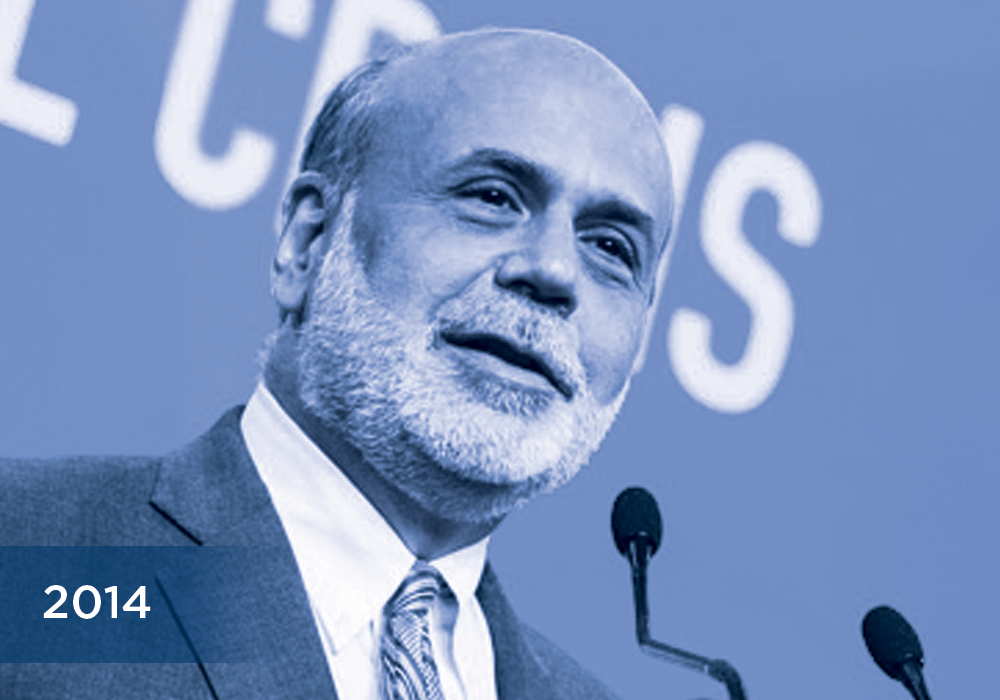
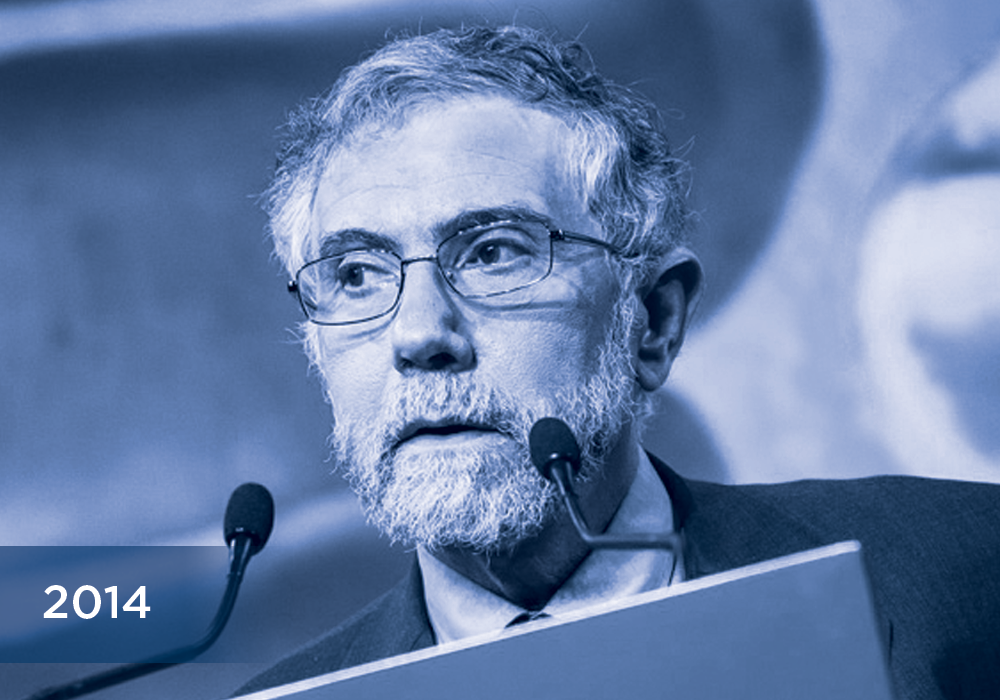
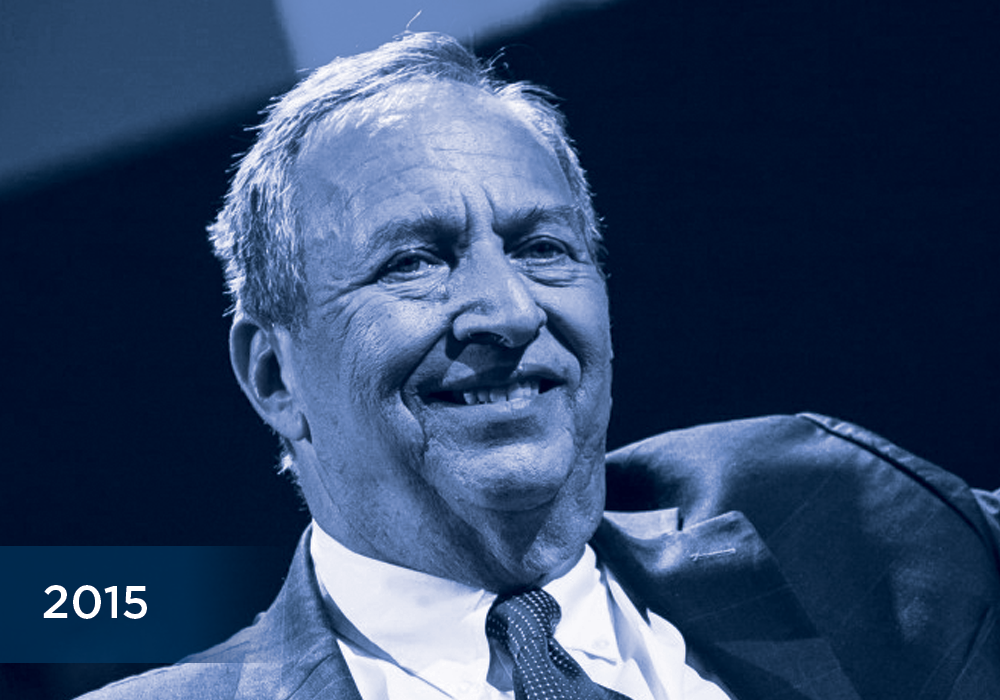
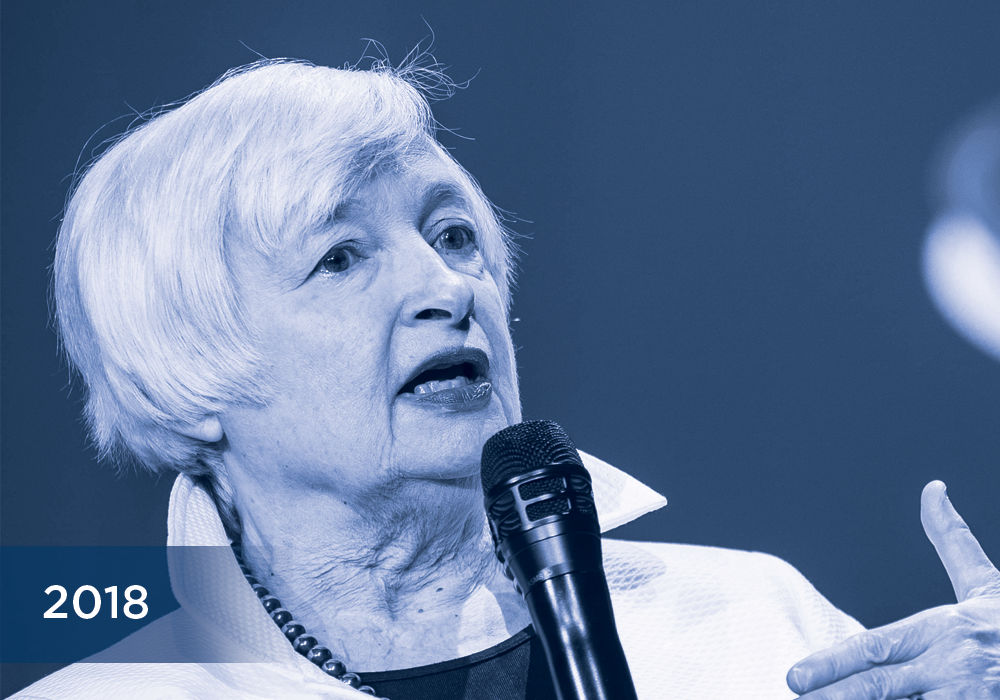
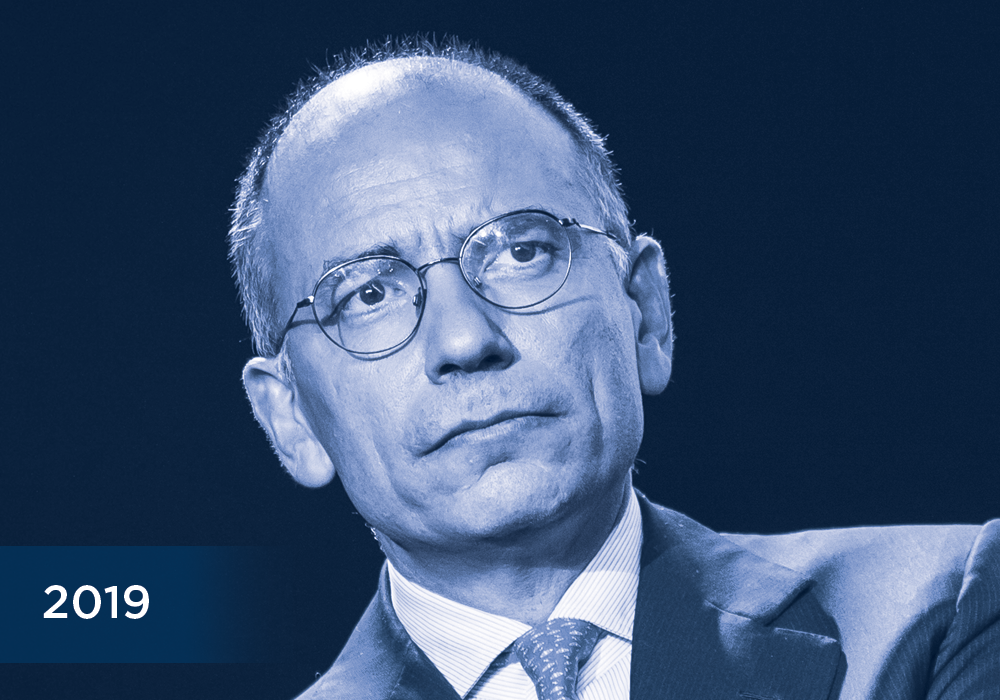
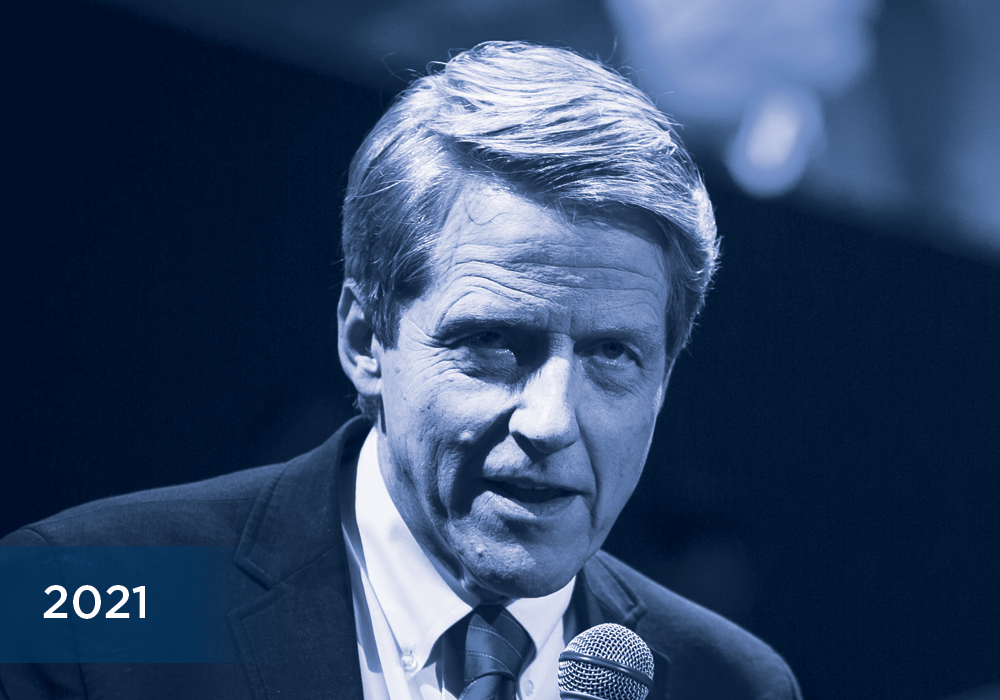
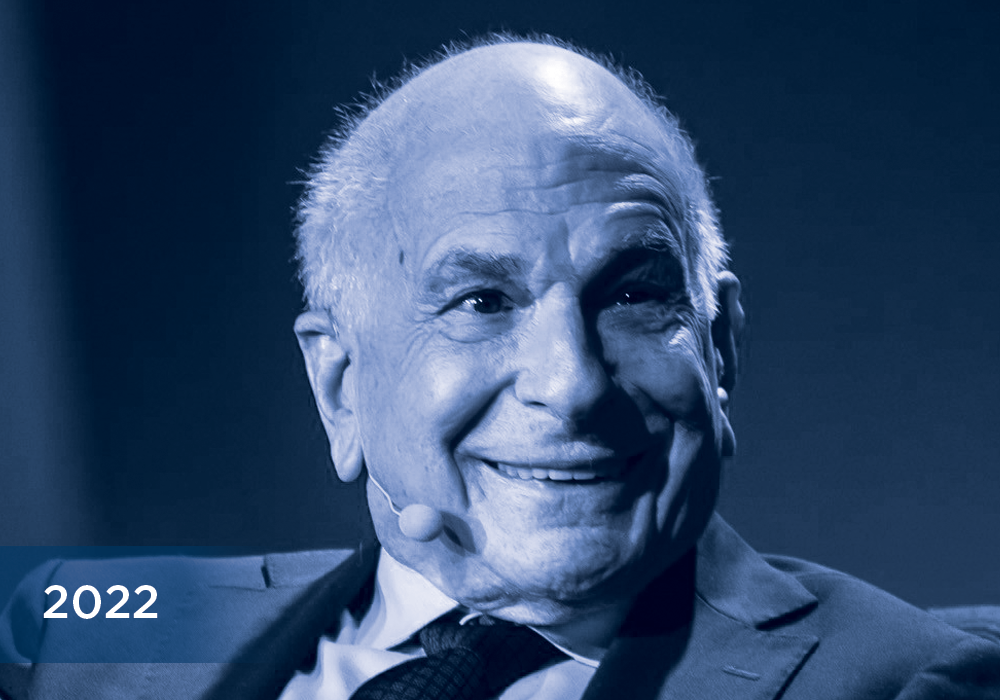
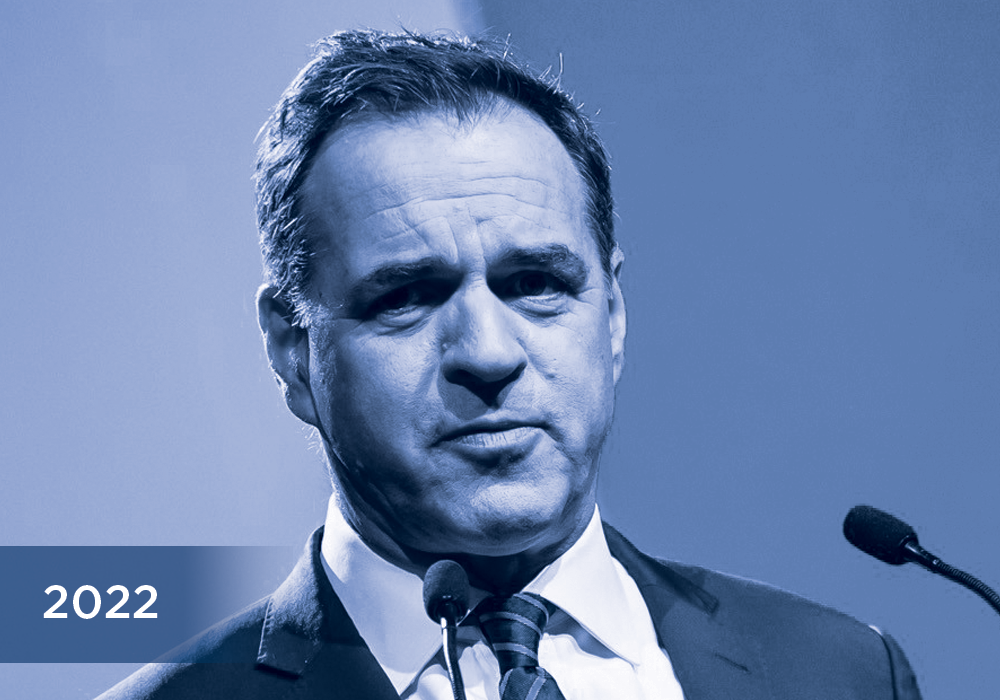
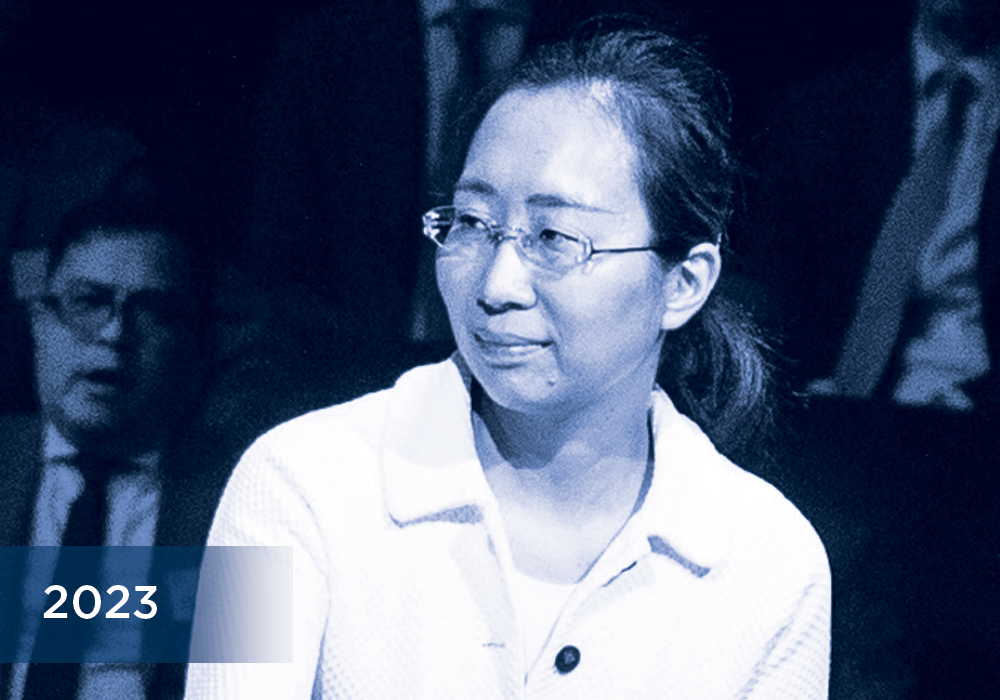
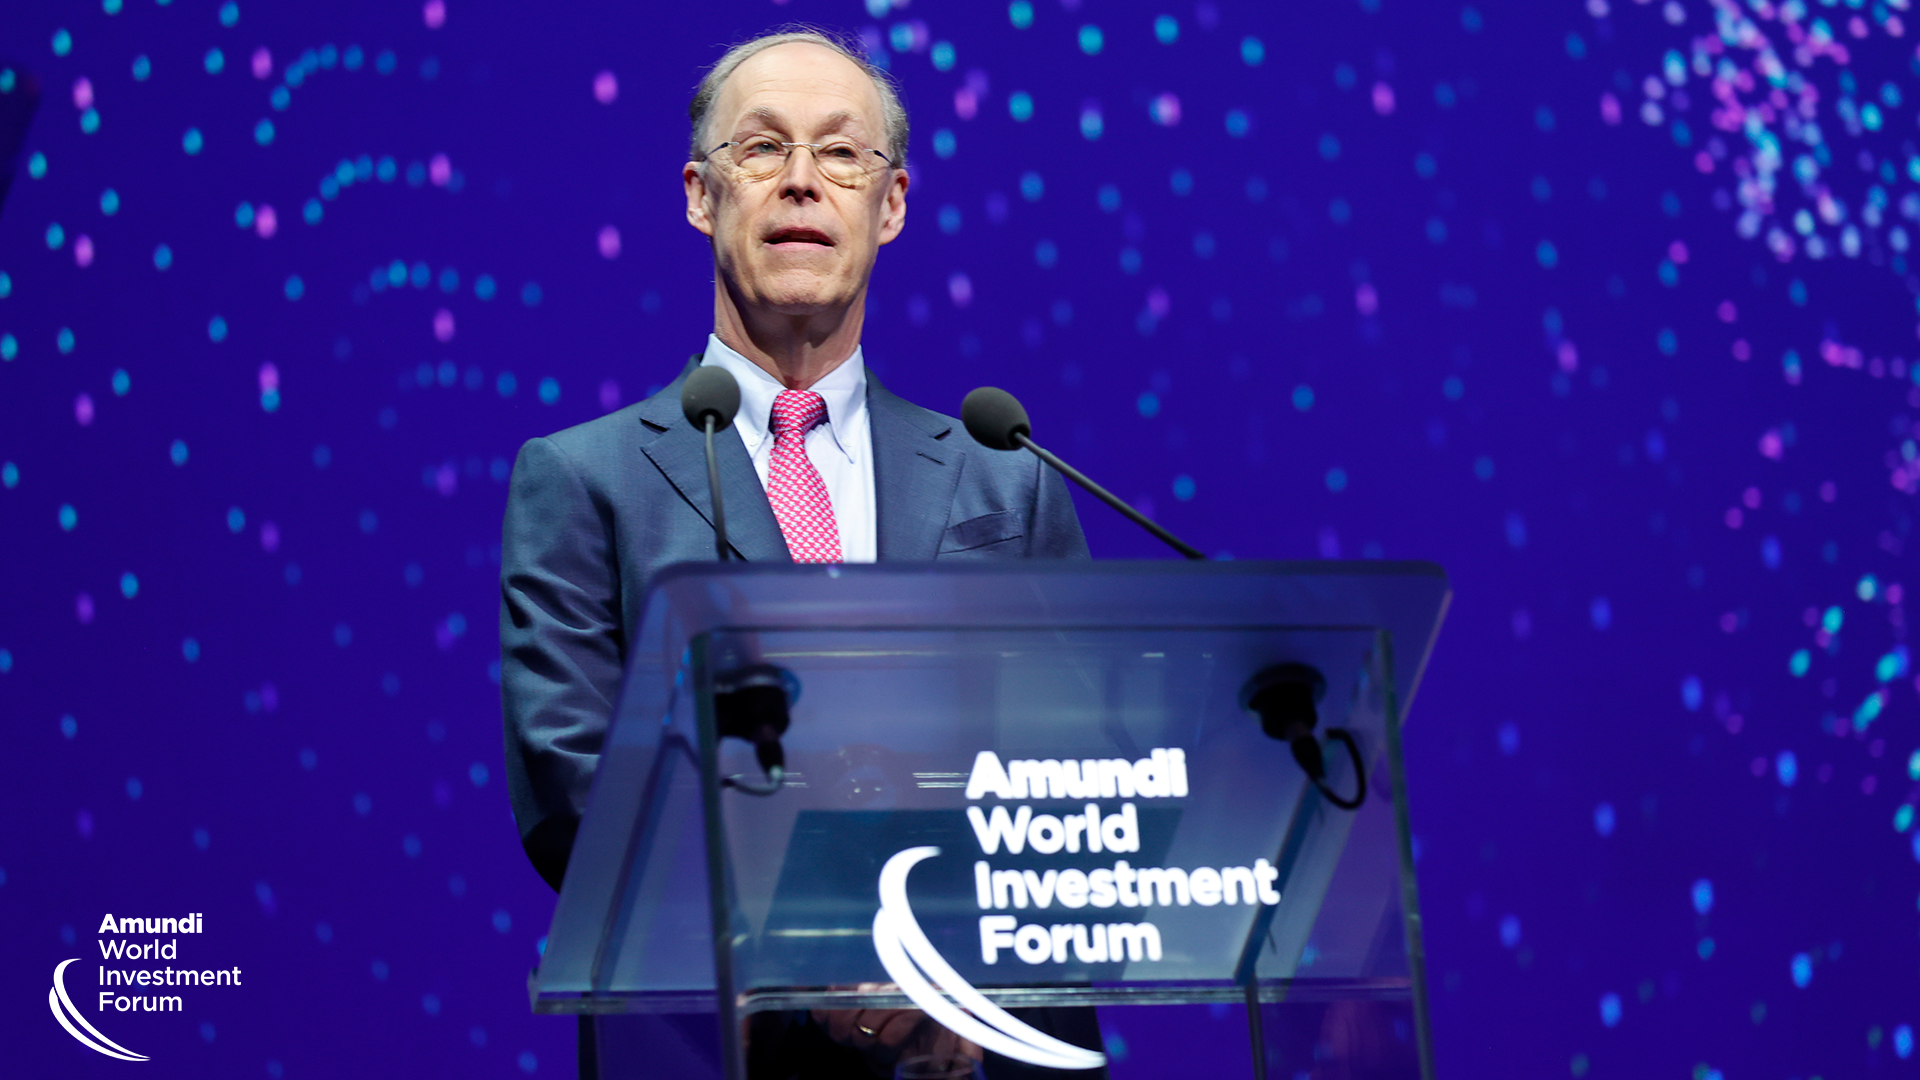
Speaker highlights from previous editions
IMF Chief Economist (2001-03)
Nobel Prize - Economics (2001)
Chair of the FED (2006-14)
Nobel Prize – Economics (2008)
U.S. Secretary of the Treasury (1999-2001) and Director of the National Economic Council (2009-2010)
Chair - State Bank of India (2013-17)

EU High Rep. for Foreign Affairs & Security Policy (2009-14)

Chair of the FED (2014-18)
Prime Minister of Italy (2013-14)
U.S. Secretary of State (2013-17)

Nobel Prize - Economics (2018)
Senior VP & Chief Economist - World Bank Group

Nobel Prize - Economics (2019)
Professor in the Economics of Innovation & Public Value - University College London
Chair – Bank of England
Nobel Prize - Economics (2013)
Nobel Prize - Economics (2002)
U.S. Secretary of State (2009-13)

Milbank Family Senior Fellow at the Hoover Institution, Stanford University
Professor of Economics emeritus - MIT & Senior Fellow at the Peterson Institute for International Economics

Professor of Political Economy, University of Cambridge

Senior Research fellow on China at Chatham House
DPrime Minister of Italy (2021-2022)
Former President of the European Central Bank (2011-2019)
Nobel Memorial Prize in Economic Sciences (2022)
Merton H. Miller Distinguished Service Professor of Finance
University of Chicago’s Booth School of Business
Replays & Insights
( breakout sessions per day


More insights
Discover our latest views on the global economy, central bank actions, and the main geopolitical events moving financial markets.
For assistance or more information

This website is solely for informational purposes.
This website does not constitute an offer to sell, a solicitation of an offer to buy, or a recommendation of any security or any other product or service. Any securities, products, or services referenced may not be registered for sale with the relevant authority in your jurisdiction and may not be regulated or supervised by any governmental or similar authority in your jurisdiction.
Furthermore, nothing in this website is intended to provide tax, legal, or investment advice and nothing in this website should be construed as a recommendation to buy, sell, or hold any investment or security or to engage in any investment strategy or transaction. There is no guarantee that any targeted performance or forecast will be achieved.